Home

Monday, 30 September 2019

Sunday, 29 September 2019

Intraday trading, Positional trading, swing trading & Long term investing is a different ball game. It's like difference in timeframe b/w test match, ODI and t20 cricket. Even though the game is same, strategies to win is different.
The mother of all bull markets have started. Markets movemuch before economy bottoms. Whether we r in recession or not, still we have so many good companies available at mouth watering prices. If you can buy them in truck load & have patience to hold it tight, you will make big!
1) Don't beg anyone to stay. 2) Save space for people who matter. 3) Keep your circle small. 4) Accept what you cannot change. 5) Leave behind what isn't good for you. 6) Do more and expect less. 7) Give time for yourself and love yourself. 8) Regret nothing.
Image
Don't judge the path I choose to take if you haven't walked the journey I had to make.

Wednesday, 25 September 2019

Image

What Are The Best Technical Indicators?

Technical indicators give traders ways to quantify and measure price action. A technical indicator can show the direction of the current trend, volatility, momentum, and whether a market is overbought or oversold. The best use of technical indicators is to use them to create great risk/reward ratios on entry. Technical indicators can also be the primary filters for quantifying entries and exits during system backtesting. 
Signals derived from technical indicators can help traders filter out their own opinions and predictions and instead focus on the momentum and trend of price action. These tools help traders develop ways to capture trends in their own trading time frame. The following are the four that I have found to be the best technical indicators for price action trading. 
A moving average shows the direction of a market in the time frame that is correlated with the length of the moving average. Markets are in up trends when over and down trends when under a moving average for that time frame. Moving averages are great for quantifying and trading trends but are ineffective during sideways or volatile markets when no trend is established. Moving averages can be combined to create crossover systems that filter out volatility by only triggering entry and exit signals when a short moving average crosses over a longer term moving average. Moving averages are easy to backtest and can be used to create mechanical trading systems. They are also good filters for discretionary trading to establish the current trend. 
Moving Averages

Chart Courtesy of TrendSpider.com
The Moving Average Convergence Divergence indicator (MACD) is a measure of price momentum. The MACD crossover can signal an intermediate swing trade and also be used as a filter to see the direction of the momentum of a market. The MACD can give a cross over or cross under signal showing a change in market trend and momentum before a moving average crossover system as it reacts faster to a loss of momentum that moving averages in most situations. In very dull markets over long periods of time the MACD can become flat and the lines converge not giving clear signals. The MACD is best used as filter to measure the current momentum of a market direction. 

MACD Technical Indicator

The Average True Range (ATR) can be used in many ways. A declining ATR shows volatility decreasing but an expanding  ATR shows volatility increasing. This is a technical indicator to help calibrate position sizing and quantify risk. The ATR can also be used as a trailing stop as it can establish how many ATRs in movement you want to risk against your position on entry after you establish your position sizing.

ATR Average True Range


The Relative Strength Indicator (RSI) is a measure of how far and how fast price action moved in one direction. RSI shows the risk/reward ratio increasing and decreasing as swing or trend direction continues. He high or low RSI reading is a warning that a market moved too far and too fast with no pullback and the risk reward/ratio is starting to skew against a position. The 30 RSI favors long positions and buying the dip in most cases as the market has become oversold and the 70 RSI reading favors selling long positions and locking in profits as the market has become overbought at those levels in the majority of circumstances. When a market has an extended parabolic move in one direction the RSI is not valid, but the majority of the time it indicates short term tops and bottoms even in swinging and trending markets. 


"The four most dangerous words in investing are: this time it's different." - Sir John Templeton
Many think clothes and accessories make you look rich, but I believe a man who is debt-free wears that confidence on his face. The ability to be patient, thoughtful, and unhurried in decision making belongs to the man whose time and money is his own.
Image
Tomorrow market is crucial to decide whether the rally continues or not? On nifty futures 11400 and on Bank nifty futures 29400 is crucial support and gaps held.
Nobody in this world is born as a friend or as an enemy... but our behaviour, attitude and character makes them what they are to us..!!
See Meltdown in #PAGE ?? PANIC not started in #EICHER #HEROMOT #ESCORTS Dyan rako #MARUTI........................6788-----------& GET YOUR #BENZ free !!!
Image
TEJI walo ka mooh kala........................................... Given warning on #Monday #Tuesday ..............but u all listen to Born Pimps registered with #SEBI ,U watch #Bluechannels and follow Idiots on social Media !! ▬Learn chart reading ▬Get on Mentor in life !!


When u can't control stocks......................then please Don't trade !!!

Image
Image

Tuesday, 24 September 2019

Trading is 1% theory and 99% practice. This means that you'll never get to do it successfully until you’re in the field, getting your ass kicked by the market and learning along the way. No book or course will really teach you that because you need to experience it yourself.
3 things to keep private. Your love life. Your income. Your next move.
Image
Trading should be done based on your system, not based on your emotion.... Day trader doesn't mean I have to strictly trade every day..... I think like this....There are around 240 trading days in a year....if I miss 3 days still I have 237 days left
👍
The trading world doesn’t have a shortage of very good traders. What the trading arena lacks is continuous persistence and extraordinary hard-work.

Monday, 23 September 2019

Image
Life is short and unpredictable. Don't waste another minute on the people, places and things that don't make you happy.
Image
"If you personalize losses, you can't trade." - Bruce Kovner
Image
Trading success is not counted by how high your P/L climbed but by how many people you brought with you.

Sunday, 22 September 2019

PRECISION beats Power, and TIMING beats speed! Have the DISCIPLINE to wait for the right TIMING to strike with PRECISION at your target! Entry is everything in this game!
#REDALERT : Any stock.............................if revives by 5-7 %......................................and if u have lion heart and strategy to trade. ▬Mint Millions ▬In next 72 hrs........................sharpest fall will happen ▬More to our Members
15 Rules to Live By •Be Thankful. •Be Kind. •Be Useful. •Be Strong. •Be Loving. •Be Honorable. •Be Respectful. •Never Quit. •Never Fear. •Refuse To Lose. •Stay Happy. •Stay Healthy. •Stay Faithful. •Stay Confident. •Remain Humble.

Saturday, 21 September 2019

Image
Best trader I ever coached, was a trading client who was also a champion poker player. When I asked him what made him better than most other players, he said ‘It was his ability to walk away’. He has the same mindset in trading. ‘Disengaging & Detaching’ & ‘Letting Go’.

Image
We spend money we don’t have on things we don’t need to impress people that don’t care

AMAZING RESULT(30%) 45000/ IN SEP MONTH SEE LEDGER : EARN MONTHLY GOOD RETURNS : For more ring US !!

No photo description available.

BOOKED 11000++ YESTERDAY WAS MEGA MULTIPLE BLAST MOVE

Image

Friday, 20 September 2019

Effective Corporate tax rates across globe now: INDIA 25.17% CHINA 25% USA 21% Over 2.5lakh companies paid over 25% effective tax rate last year 2017-18 now to benefit from this move. 1.45 lakh crores is the cost estimated (Revenue loss) becoz of these sops.
Close to 7lakh crore added to market cap becoz of big bang Corporate stimulus announced by
@nsitharaman
Basic corporate tax rate cut to 22% from 30%. Effective tax rate inclusive of surcharge and cess now @ 25.17%

Wednesday, 18 September 2019

ENJOIYYY MARKETING DEFINITIONS

Image

If this doesn't reverse to 10790-820 , let's see !

Image


If this doesn't reverse to 10790-820 , let's see !

Deal with your problems before they deal with your happiness.
"People who don't take risks generally make about two big mistakes a year. People who do take risks generally make about two big mistakes a year." ~ Peter Drucker
Image
Before you invest, check that the fund invests in businesses that have good promoters, are scalable, and have a clear competitive advantage and capital efficiency. This is how wealth gets created over the long term.
Do not look at the Mathematics behind share prices, EPS, PE, Corporate Earnings, as Maths has never helped Trump to win Japan elections. Just have faith in our policies, your shares will double by 2024. Economy double, Farmers income double, Share prices double by 2024
😛
Does the Market even know what it wants .25% .50% or zero. US economic Data not exactly weak lately
Most say that good trading requires discipline. Yes, it does, to avoid impulsive behavior and emotional bias. But, at times, it also requires breaking discipline; literally doing the exact opposite to adjust to market nuances. The art is to master when to bend that discipline.
“99% of the world is convinced they are incapable of achieving great things, so they aim for the mediocre middle-ground. The level of competition is thus fiercest for ‘realistic’ goals, paradoxically making them the most time- and energy-consuming." ~ Tim Ferriss
Don't compare your results to someone else's. You can never be another person, you can only be a better version of yourself.

There is no growth nor victory, without pain.

Image
It isn't a matter of forgetting your trading mistakes. What one has to learn is how to remember and yet be free of the past losing trades.
Image

Tuesday, 17 September 2019

Beautiful things happen when you distance yourself from negativity.
Modi 69 Nifty - 169
⬇
Sensex - 669
⬇
Banknifty - 769
⬇
now that's tribute to 69
😉
Image

BOOKED 7000++

DAY DONE:

BOOKED 7000++ MANY ONE ASKING WHY NOT UPDATING DAILY WITH LOT OF QUESTIONS: SAID TO ALL COME ON TEAM VIEWER I'LL SHOW MY LEDGER !!

Image


Monday, 16 September 2019

What areas should we look at to Identify Quality Trade Targets for our Take Profit locations -Daily & Weekly Pivots (look for confluence when available) and consider TP's prior to the pivot -Average Daily and Weekly ranges -Measured Moves -Fib Extensions -Trailing stop loss
→The mutual fund industry managed to garner Rs 8,231 crore through (SIPs) in August →, total SIP contribution in the first five months of the current fiscal rose to Rs 41,098 crore as compared to Rs 36,760 crore in April-August 2018 →MF have 2.81 crore SIP A/c
‘The Art of Trading is learning to sit around and do nothing, when everything in your mind screams at you to do something, balanced with having the guts to do something when everything in your mind screams at you not to do nothing.’

Image
With courage you will dare to take risks, have strength to be compassionate, and wisdom to be humble. Courage is the foundation of integrity
No matter how successful you are, always maintain a student mindset. This will keep your ego in check as you're acknowledging that you always have more to learn.

Sunday, 15 September 2019

Saturday, 14 September 2019

How to Identify A Trend Reversal In A Stock

This is a list of things to look for as possible signs before a stock makes a top and rolls over. Alone these are just possibilities but the probabilities increase as more of the signs are in place.
  • When the RSI gets near 70 on the daily chart for a stock and it becomes overbought resistance, the price momentum to the upside slows, and the the price settles into a trading range.
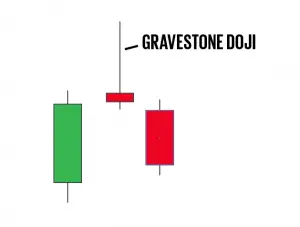
  • A Gravestone Doji is a bearish candlestick that indicates a downside reversal could be about to take place. This candle shows a lack of buyers holding positions at higher prices and profit taking setting in. Price ends up near where it started after higher prices are rejected. 
  • If  the market opens higher but fails to go over the opening price level for the entire trading day, this is a sign that buyers are rejecting higher prices. This is called a hammer or hanging man candlestick. 
  • The market opens below the previous days trading range and never gets over the previous days low, that is an early sign of a new trading range.
  • The market starts to open higher but closes lower, that is a sign of distribution.
  • The average daily trading range expands and volatility starts to grow.
  • A huge volume day that gaps way up and then sells off into negative territory on high volume.
  • A stock is far extended from all moving averages. The odds increase for a reversion to at least the 5 day or 10 day moving average. 
  • A major “good news” event happens but with little or no price movement higher, and the market is out of catalysts to drive it higher.
  • When the majority of people think the stock will not pullback and they are against you short selling the stock.
These are just things to look for that could result in a short term top that lasts weeks or months and maybe nothing more than a pullback or a new range being traded. There are times to buy a breakout and times to wait for a pullback. There is a fine line between chasing the market higher and buying momentum. 

#SUNDAYUPDATE

Image
"The mistake is not being wrong. The mistake is staying wrong." - John Hill

Image
Best way to earn respect is.. by treating others with respect.